
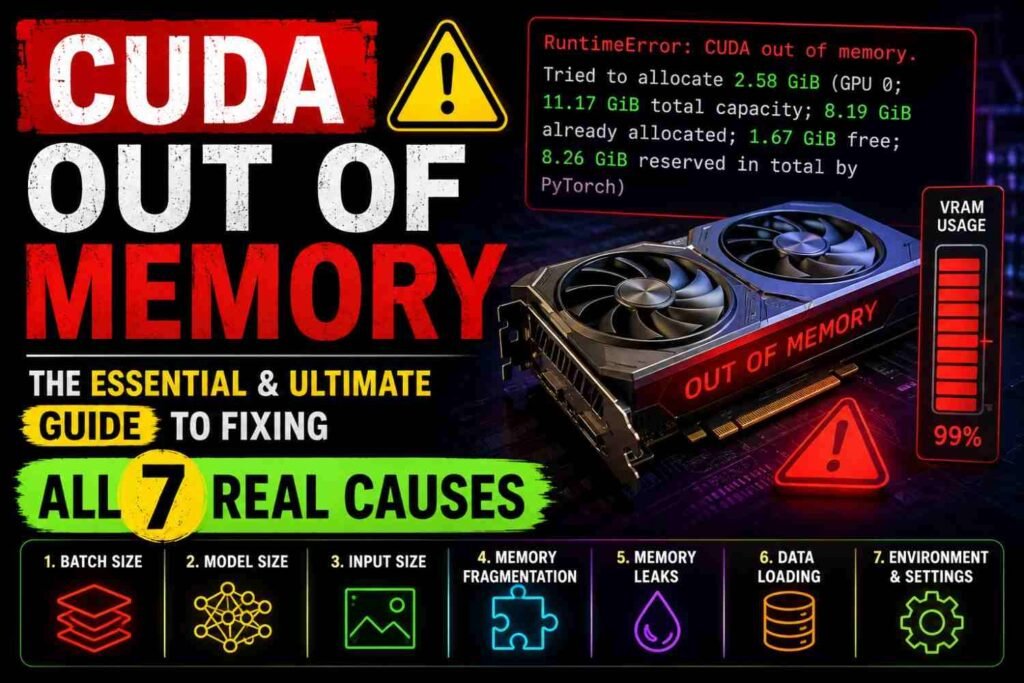
torch.cuda.OutOfMemoryError almost never means “buy a bigger GPU.” It means one specific allocation failed at one specific moment, and there are seven distinct reasons that happens. The error message itself tells you which one — most people just never read past the first line.
This guide covers how to read the error, the seven causes, and the fix for each. Start with the diagnosis; the fixes only work if you match them to the right cause.
First: Read the CUDA Out of Memory Error Message Properly
A typical PyTorch OOM looks like this:
torch.cuda.OutOfMemoryError: CUDA out of memory.
Tried to allocate 2.00 GiB (GPU 0; 8.00 GiB total capacity;
5.13 GiB already allocated; 1.79 GiB free; 5.94 GiB reserved in total by PyTorch)
Four numbers matter, and the relationship between them is the diagnosis:
| Field | What it means |
|---|---|
| Tried to allocate | The size of the single request that failed |
| already allocated | Memory currently held by live tensors |
| reserved in total by PyTorch | Memory PyTorch has taken from the driver, including memory it is caching but not using |
| free | Free inside PyTorch’s reserved pool |
The key comparison: if reserved is much larger than already allocated, and the failed allocation is smaller than the gap between them, you have fragmentation — not a capacity problem. In the example above, PyTorch reserved 5.94 GiB but only 5.13 GiB is live. There is 0.81 GiB sitting in the pool, plus 1.79 GiB free, yet a 2.00 GiB request still failed. That is cause 3, and adding a smaller batch size will not help you.
If already allocated is close to reserved and both are close to total capacity, you genuinely have a capacity problem — causes 1, 2, 4 or 6.
Cause 1: When Model Weights Don’t Fit (CUDA Out of Memory Error)
The most common cause, and the easiest to check with arithmetic rather than trial and error.
Definition — model weight memory: the parameter count multiplied by the bytes per parameter.
| Precision | Bytes per parameter | 7B model | 13B model | 30B model |
|---|---|---|---|---|
| FP32 | 4 | 28 GB | 52 GB | 120 GB |
| FP16 / BF16 | 2 | 14 GB | 26 GB | 60 GB |
| INT8 | 1 | 7 GB | 13 GB | 30 GB |
| INT4 | 0.5 | 3.5 GB | 6.5 GB | 15 GB |
Those figures are weights only. Add KV cache, activations and CUDA context overhead (roughly 0.5–1 GB before you load anything) on top.
The fix: quantize. Moving from FP16 to a 4-bit quant cuts weight memory by 4×, and for inference the quality cost is usually far smaller than people expect. If you are still over budget after 4-bit, you need a smaller model or CPU offloading — no allocator setting will save you.
How to tell this is your cause: the OOM happens during model loading, before you run a single token.
Cause 2: CUDA Out of Memory Due to KV Cache Growth During Long Conversations
This is the cause people miss, because the model loads fine and then dies twenty minutes into a long conversation.
Definition — KV cache: the stored key and value tensors for every token processed so far, kept so the model does not recompute attention over the entire sequence at each new token. It grows linearly with context length, and it is not included in any “model size” figure you read on Hugging Face.
The formula, per Sebastian Raschka’s breakdown:
bytes_per_token = 2 × num_layers × num_kv_heads × head_dim × bytes_per_elementThe leading 2 is for the key tensor and the value tensor. For BF16, bytes_per_element is 2, so it collapses to 4 × num_layers × num_kv_heads × head_dim.
For Qwen3 8B (36 layers, 8 KV heads, 128 head dim), that is 144 KiB per token. At 32,768 tokens of context, the KV cache alone is 4.8 GB — on top of the weights.
The fix: cap your context length to what you actually need, enable KV cache quantization if your runtime supports it (--cache-type-k q8_0 in llama.cpp), or pick a model with aggressive grouped-query attention. Doubling context doubles this number; there is no way around the linear growth.
How to tell this is your cause: it works on short prompts and dies on long ones, or dies partway through a long generation.
Cause 3: CUDA Out of Memory from Memory Fragmentation
You have free VRAM. The allocation still fails. This is the most confusing OOM and the most misdiagnosed.
Definition — fragmentation: free memory exists, but not as a single contiguous block large enough for the request.
PyTorch’s allocator works in two layers, documented in the PyTorch devlog: segments are contiguous regions obtained from cudaMalloc, and blocks are sub-regions inside them. When a block is freed, the allocator tries to merge it with neighbours — but the critical constraint is that blocks in different segments can never merge.
The devlog gives a clean worked example. Allocate eight 16 MiB tensors and you get eight independent segments. Free them all and you have eight isolated 16 MiB free blocks — 128 MiB of free memory. Now request four 32 MiB allocations. None of them fit in a 16 MiB hole, so the allocator calls cudaMalloc four more times, reserving 256 MiB in total when 128 MiB was already sitting idle.
The fix, in order of how much you should try it:
1. Set expandable segments:
export PYTORCH_CUDA_ALLOC_CONF=expandable_segments:TrueThis uses CUDA’s virtual memory APIs to reserve one large virtual address range per pool and map physical pages on demand. Because every block then lives in the same segment, adjacent free blocks merge regardless of the order you allocated them in. This one line resolves a large share of fragmentation OOMs.
2. Call torch.cuda.empty_cache() to return cached blocks to the driver. Note this only helps if the blocks are genuinely free — it does not defragment live allocations, and calling it in a hot loop will slow you down considerably.
3. Keep allocation sizes consistent. Fixed-size batches fragment far less than variable-length ones.
Worth knowing: expandable segments do not eliminate fragmentation entirely. If long-lived allocations are interleaved with short-lived ones in the same pool, free space still ends up stranded around the live tensors. Allocations also route to separate pools either side of a 1 MiB boundary, so memory cannot be shared across that threshold.
How to tell this is your cause: reserved significantly exceeds already allocated, and the failed request is smaller than the difference.
Cause 4: Batch Size and Concurrent Sequences Trigger CUDA Out of Memory
Every sequence in a batch carries its own activations and its own KV cache. Memory scales with batch size roughly linearly, and it scales with batch × context for the cache specifically.
The fix: lower the batch size. If throughput matters, use gradient accumulation in training, or continuous batching in serving (vLLM, TGI) which packs sequences dynamically instead of padding to the longest one.
The subtle version of this bug: a batch that works on average-length inputs and OOMs the moment one long sample arrives. Sort or bucket by length, and set a hard maximum sequence length rather than trusting your data.
How to tell this is your cause: it fails on some batches and not others, with no code change in between.
Cause 5: Another Process Holds the VRAM (Hidden CUDA Out of Memory)
Frequently a zombie Python process from a crashed run, a Jupyter kernel you forgot about, or your desktop compositor.
nvidia-smiLook at the process list at the bottom, not just the memory total. A dead notebook can hold multiple gigabytes indefinitely.
# Kill a specific offender
kill -9 <PID>

# See what is holding the GPU when nvidia-smi's list looks empty
sudo fuser -v /dev/nvidia*
On a desktop Linux or Windows machine, budget 0.5–1.5 GB for the display server before you start. Running headless, or on a second GPU, gets that back.
How to tell this is your cause: nvidia-smi shows high usage before you launch anything.
Cause 6: Optimizer States Cause CUDA Out of Memory in Training
If you are training or fine-tuning rather than running inference, weights are the smallest part of your memory bill.
| Component | Memory (relative to FP16 weights) |
|---|---|
| Weights | 1× |
| Gradients | 1× |
| Adam optimizer states (m and v) | 2× (often 4× if kept in FP32) |
A 7B model at 14 GB of FP16 weights needs roughly 70–110 GB to full-fine-tune with Adam. This is why LoRA and QLoRA exist: by freezing the base weights and training small adapter matrices, you eliminate the gradient and optimizer state cost for 99%+ of parameters.
The fix: use LoRA/QLoRA, switch to an 8-bit optimizer (bitsandbytes), enable gradient checkpointing to trade compute for activation memory, or shard across GPUs with FSDP/DeepSpeed ZeRO.
How to tell this is your cause: inference works fine, training OOMs immediately.
Cause 7: The Prefill Spike That Causes CUDA Out of Memory
Processing a long prompt is not the same workload as generating tokens. During prefill, the model computes attention over the entire input at once, and peak activation memory can briefly spike well above steady-state generation memory.
This produces the maddening pattern where a 32k-token prompt OOMs even though you calculated that the KV cache for 32k tokens fits comfortably.
The fix: enable chunked prefill if your runtime supports it (vLLM does), which processes the prompt in fixed-size segments rather than one pass. Failing that, reduce the maximum prompt length you accept.
How to tell this is your cause: the failure happens while ingesting the prompt, before the first output token appears.

A CUDA Out of Memory Diagnostic Order That Saves Time
Work through this in sequence rather than randomly changing settings:
- Run
nvidia-smi. Rule out cause 5 first — it takes ten seconds and it is embarrassingly common. - Read the four numbers in the error. If
reserved≫allocated, go straight to cause 3 and setexpandable_segments:True. - Note when it fails. Loading → cause 1. Prompt ingestion → cause 7. Mid-generation → cause 2. Some batches only → cause 4. Training only → cause 6.
- Do the weights arithmetic before you change anything. If a 30B model at FP16 needs 60 GB and you have 8 GB, no configuration flag is going to bridge that.
CUDA Out of Memory: Frequently Asked Questions
Does torch.cuda.empty_cache() fix out of memory errors?
Sometimes, and only for fragmentation. It returns cached-but-unused blocks to the driver. It cannot move live tensors, so if your memory is genuinely occupied it does nothing. Calling it inside a training loop hurts performance because PyTorch then has to re-request memory from the driver.
Why does CUDA out of memory say memory is free but still fail?
Because free memory is not necessarily contiguous. The allocator needs one unbroken block of the requested size. See cause 3.
Will expandable_segments:True slow anything down?
In most workloads the difference is negligible, and it frequently improves things by reducing cudaMalloc calls. It is worth setting by default on memory-constrained hardware.
Does quantization hurt output quality?
Less than most people assume for inference. The drop from FP16 to 8-bit is generally imperceptible; 4-bit is usually acceptable for chat and summarisation, and more noticeable on precise reasoning and code. The memory saving is 4× — for most local setups that trade is worth making.
Can I split a model across two GPUs?
Yes, via device_map="auto" in Transformers, or tensor parallelism in vLLM. Be aware that inter-GPU bandwidth becomes the bottleneck, so two 8 GB cards do not perform like one 16 GB card.
How do I permanently fix CUDA out of memory?
There is no single permanent fix for CUDA out of memory, because the error is a symptom of seven different conditions. Diagnose which one you hit using the four numbers in the error message, then apply the matching fix: quantize for weights, cap context for KV cache, set expandable segments for fragmentation, and lower batch size for throughput pressure.
CUDA Out of Memory: The Short Version
Out of memory is a diagnosis problem, not a hardware problem. Read the four numbers in the error, note the moment it failed, and match it to one of the seven causes. Set PYTORCH_CUDA_ALLOC_CONF=expandable_segments:True as a default. Do the weight arithmetic before you buy anything.
Related reading
If you are fighting CUDA out of memory while running a model locally, our walkthrough on running Meta Muse Glimmer 30B on a single GPU shows this VRAM budgeting in practice. For background on the ecosystem these models come from, see our guide to generative AI.
